fooof.FOOOF
- class fooof.FOOOF(peak_width_limits=(0.5, 12.0), max_n_peaks=inf, min_peak_height=0.0, peak_threshold=2.0, aperiodic_mode='fixed', verbose=True)[source]
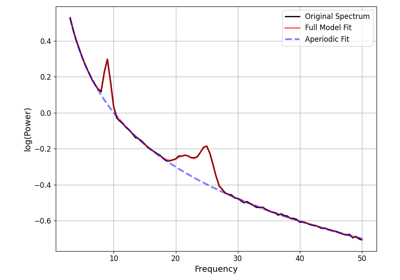
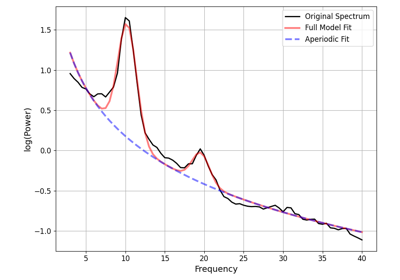
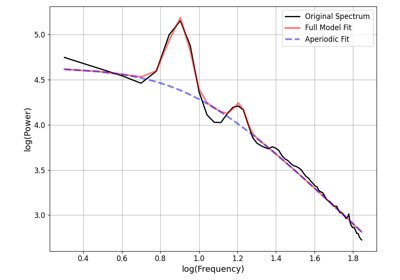
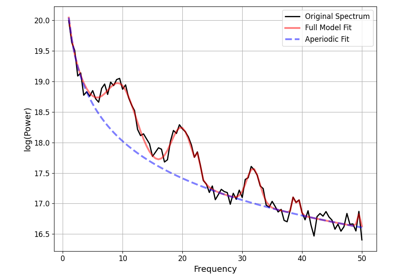
Model a physiological power spectrum as a combination of aperiodic and periodic components.
WARNING: FOOOF expects frequency and power values in linear space.
Passing in logged frequencies and/or power spectra is not detected, and will silently produce incorrect results.
- Parameters:
- peak_width_limitstuple of (float, float), optional, default: (0.5, 12.0)
Limits on possible peak width, in Hz, as (lower_bound, upper_bound).
- max_n_peaksint, optional, default: inf
Maximum number of peaks to fit.
- min_peak_heightfloat, optional, default: 0
Absolute threshold for detecting peaks. This threshold is defined in absolute units of the power spectrum (log power).
- peak_thresholdfloat, optional, default: 2.0
Relative threshold for detecting peaks. This threshold is defined in relative units of the power spectrum (standard deviation).
- aperiodic_mode{‘fixed’, ‘knee’}
Which approach to take for fitting the aperiodic component.
- verbosebool, optional, default: True
Verbosity mode. If True, prints out warnings and general status updates.
Notes
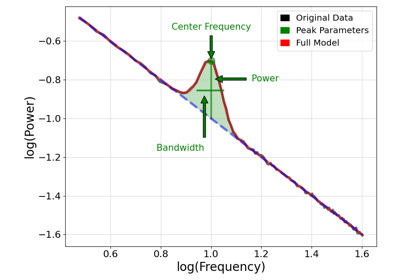
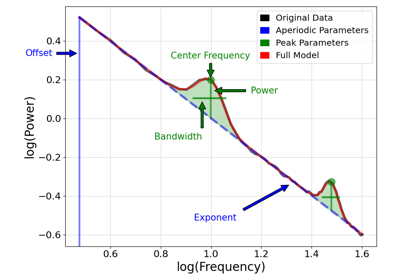
Commonly used abbreviations used in this module include: CF: center frequency, PW: power, BW: Bandwidth, AP: aperiodic
Input power spectra must be provided in linear scale. Internally they are stored in log10 scale, as this is what the model operates upon.
Input power spectra should be smooth, as overly noisy power spectra may lead to bad fits. For example, raw FFT inputs are not appropriate. Where possible and appropriate, use longer time segments for power spectrum calculation to get smoother power spectra, as this will give better model fits.
The gaussian params are those that define the gaussian of the fit, where as the peak params are a modified version, in which the CF of the peak is the mean of the gaussian, the PW of the peak is the height of the gaussian over and above the aperiodic component, and the BW of the peak, is 2*std of the gaussian (as ‘two sided’ bandwidth).
- Attributes:
- freqs1d array
Frequency values for the power spectrum.
- power_spectrum1d array
Power values, stored internally in log10 scale.
- freq_rangelist of [float, float]
Frequency range of the power spectrum, as [lowest_freq, highest_freq].
- freq_resfloat
Frequency resolution of the power spectrum.
- fooofed_spectrum_1d array
The full model fit of the power spectrum, in log10 scale.
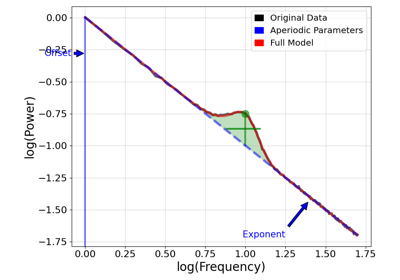
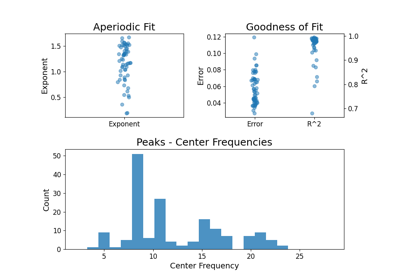
- aperiodic_params_1d array
Parameters that define the aperiodic fit. As [Offset, (Knee), Exponent]. The knee parameter is only included if aperiodic component is fit with a knee.
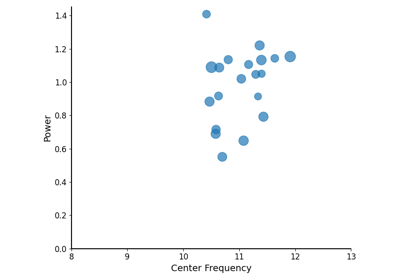
- peak_params_2d array
Fitted parameter values for the peaks. Each row is a peak, as [CF, PW, BW].
- gaussian_params_2d array
Parameters that define the gaussian fit(s). Each row is a gaussian, as [mean, height, standard deviation].
- r_squared_float
R-squared of the fit between the input power spectrum and the full model fit.
- error_float
Error of the full model fit.
n_peaks_intHow many peaks were fit in the model.
has_databoolIndicator for if the object contains data.
has_modelboolIndicator for if the object contains a model fit.
- __init__(peak_width_limits=(0.5, 12.0), max_n_peaks=inf, min_peak_height=0.0, peak_threshold=2.0, aperiodic_mode='fixed', verbose=True)[source]
Initialize object with desired settings.
Methods
__init__([peak_width_limits, max_n_peaks, ...])Initialize object with desired settings.
add_data(freqs, power_spectrum[, ...])Add data (frequencies, and power spectrum values) to the current object.
add_meta_data(fooof_meta_data)Add data information into object from a FOOOFMetaData object.
add_results(fooof_result)Add results data into object from a FOOOFResults object.
add_settings(fooof_settings)Add settings into object from a FOOOFSettings object.
copy()Return a copy of the current object.
fit([freqs, power_spectrum, freq_range])Fit the full power spectrum as a combination of periodic and aperiodic components.
get_data([component, space])Get a data component.
Return data information from the current object.
get_model([component, space])Get a model component.
get_params(name[, col])Return model fit parameters for specified feature(s).
Return model fit parameters and goodness of fit metrics.
Return run modes of the current object.
Return user defined settings of the current object.
load(file_name[, file_path, regenerate])Load in a FOOOF formatted JSON file to the current object.
plot([plot_peaks, plot_aperiodic, freqs, ...])Plot the power spectrum and model fit results from a FOOOF object.
print_report_issue([concise])Prints instructions on how to report bugs and/or problematic fits.
print_results([concise])Print out model fitting results.
print_settings([description, concise])Print out the current settings.
report([freqs, power_spectrum, freq_range, ...])Run model fit, and display a report, which includes a plot, and printed results.
save(file_name[, file_path, append, ...])Save out data, results and/or settings from a FOOOF object into a JSON file.
save_report(file_name[, file_path, plt_log, ...])Generate and save out a PDF report for a power spectrum model fit.
set_check_data_mode(check_data)Set check data mode, which controls if an error is raised if NaN or Inf data are added.
set_check_modes([check_freqs, check_data])Set check modes, which controls if an error is raised based on check on the inputs.
set_debug_mode(debug)Set debug mode, which controls if an error is raised if model fitting is unsuccessful.
set_run_modes(debug, check_freqs, check_data)Simultaneously set all run modes.
to_df(peak_org)Convert and extract the model results as a pandas object.
Attributes
Indicator for if the object contains data.
Indicator for if the object contains a model fit.
How many peaks were fit in the model.
- add_data(freqs, power_spectrum, freq_range=None, clear_results=True)[source]
Add data (frequencies, and power spectrum values) to the current object.
- Parameters:
- freqs1d array
Frequency values for the power spectrum, in linear space.
- power_spectrum1d array
Power spectrum values, which must be input in linear space.
- freq_rangelist of [float, float], optional
Frequency range to restrict power spectrum to. If not provided, keeps the entire range.
- clear_resultsbool, optional, default: True
Whether to clear prior results, if any are present in the object. This should only be set to False if data for the current results are being re-added.
Notes
If called on an object with existing data and/or results they will be cleared by this method call.
- add_meta_data(fooof_meta_data)[source]
Add data information into object from a FOOOFMetaData object.
- Parameters:
- fooof_meta_dataFOOOFMetaData
A meta data object containing meta data information.
- add_results(fooof_result)[source]
Add results data into object from a FOOOFResults object.
- Parameters:
- fooof_resultFOOOFResults
A data object containing the results from fitting a FOOOF model.
- add_settings(fooof_settings)[source]
Add settings into object from a FOOOFSettings object.
- Parameters:
- fooof_settingsFOOOFSettings
A data object containing the settings for a FOOOF model.
- fit(freqs=None, power_spectrum=None, freq_range=None)[source]
Fit the full power spectrum as a combination of periodic and aperiodic components.
- Parameters:
- freqs1d array, optional
Frequency values for the power spectrum, in linear space.
- power_spectrum1d array, optional
Power values, which must be input in linear space.
- freq_rangelist of [float, float], optional
Frequency range to restrict power spectrum to. If not provided, keeps the entire range.
- Raises:
- NoDataError
If no data is available to fit.
- FitError
If model fitting fails to fit. Only raised in debug mode.
Notes
Data is optional, if data has already been added to the object.
- get_data(component='full', space='log')[source]
Get a data component.
- Parameters:
- component{‘full’, ‘aperiodic’, ‘peak’}
- Which data component to return.
‘full’ - full power spectrum ‘aperiodic’ - isolated aperiodic data component ‘peak’ - isolated peak data component
- space{‘log’, ‘linear’}
- Which space to return the data component in.
‘log’ - returns in log10 space. ‘linear’ - returns in linear space.
- Returns:
- output1d array
Specified data component, in specified spacing.
Notes
The ‘space’ parameter doesn’t just define the spacing of the data component values, but rather defines the space of the additive data definition such that power_spectrum = aperiodic_component + peak_component. With space set as ‘log’, this combination holds in log space. With space set as ‘linear’, this combination holds in linear space.
- get_meta_data()[source]
Return data information from the current object.
- Returns:
- FOOOFMetaData
Object containing meta data from the current object.
- get_model(component='full', space='log')[source]
Get a model component.
- Parameters:
- component{‘full’, ‘aperiodic’, ‘peak’}
- Which model component to return.
‘full’ - full model ‘aperiodic’ - isolated aperiodic model component ‘peak’ - isolated peak model component
- space{‘log’, ‘linear’}
- Which space to return the model component in.
‘log’ - returns in log10 space. ‘linear’ - returns in linear space.
- Returns:
- output1d array
Specified model component, in specified spacing.
Notes
The ‘space’ parameter doesn’t just define the spacing of the model component values, but rather defines the space of the additive model such that model = aperiodic_component + peak_component. With space set as ‘log’, this combination holds in log space. With space set as ‘linear’, this combination holds in linear space.
- get_params(name, col=None)[source]
Return model fit parameters for specified feature(s).
- Parameters:
- name{‘aperiodic_params’, ‘peak_params’, ‘gaussian_params’, ‘error’, ‘r_squared’}
Name of the data field to extract.
- col{‘CF’, ‘PW’, ‘BW’, ‘offset’, ‘knee’, ‘exponent’} or int, optional
Column name / index to extract from selected data, if requested. Only used for name of {‘aperiodic_params’, ‘peak_params’, ‘gaussian_params’}.
- Returns:
- outfloat or 1d array
Requested data.
- Raises:
- NoModelError
If there are no model fit parameters available to return.
Notes
If there are no fit peak (no peak parameters), this method will return NaN.
- get_results()[source]
Return model fit parameters and goodness of fit metrics.
- Returns:
- FOOOFResults
Object containing the model fit results from the current object.
- get_run_modes()[source]
Return run modes of the current object.
- Returns:
- FOOOFRunModes
Object containing the run modes from the current object.
- get_settings()[source]
Return user defined settings of the current object.
- Returns:
- FOOOFSettings
Object containing the settings from the current object.
- property has_data
Indicator for if the object contains data.
- property has_model
Indicator for if the object contains a model fit.
Notes
This check uses the aperiodic params, which are:
nan if no model has been fit
necessarily defined, as floats, if model has been fit
- load(file_name, file_path=None, regenerate=True)[source]
Load in a FOOOF formatted JSON file to the current object.
- Parameters:
- file_namestr or FileObject
File to load data from.
- file_pathPath or str, optional
Path to directory to load from. If None, loads from current directory.
- regeneratebool, optional, default: True
Whether to regenerate the model fit from the loaded data, if data is available.
- property n_peaks_
How many peaks were fit in the model.
- plot(plot_peaks=None, plot_aperiodic=True, freqs=None, power_spectrum=None, freq_range=None, plt_log=False, add_legend=True, save_fig=False, file_name=None, file_path=None, ax=None, data_kwargs=None, model_kwargs=None, aperiodic_kwargs=None, peak_kwargs=None, **plot_kwargs)[source]
Plot the power spectrum and model fit results from a FOOOF object.
- Parameters:
- plot_peaksNone or {‘shade’, ‘dot’, ‘outline’, ‘line’}, optional
What kind of approach to take to plot peaks. If None, peaks are not specifically plotted. Can also be a combination of approaches, separated by ‘-’, for example: ‘shade-line’.
- plot_aperiodicboolean, optional, default: True
Whether to plot the aperiodic component of the model fit.
- freqs1d array, optional
Frequency values of the power spectrum to plot, in linear space. If provided, this overrides the values in the model object.
- power_spectrum1d array, optional
Power values to plot, in linear space. If provided, this overrides the values in the model object.
- freq_rangelist of [float, float], optional
Frequency range to plot, defined in linear space.
- plt_logboolean, optional, default: False
Whether to plot the frequency values in log10 spacing.
- add_legendboolean, optional, default: False
Whether to add a legend describing the plot components.
- save_figbool, optional, default: False
Whether to save out a copy of the plot.
- file_namestr, optional
Name to give the saved out file.
- file_pathPath or str, optional
Path to directory to save to. If None, saves to current directory.
- axmatplotlib.Axes, optional
Figure axes upon which to plot.
- data_kwargs, model_kwargs, aperiodic_kwargs, peak_kwargsNone or dict, optional
Keyword arguments to pass into the plot call for each plot element.
- **plot_kwargs
Keyword arguments to pass into the
style_plot.
Notes
Since FOOOF objects store power values in log spacing, the y-axis (power) is plotted in log spacing by default.
- static print_report_issue(concise=False)[source]
Prints instructions on how to report bugs and/or problematic fits.
- Parameters:
- concisebool, optional, default: False
Whether to print the report in a concise mode, or not.
- print_results(concise=False)[source]
Print out model fitting results.
- Parameters:
- concisebool, optional, default: False
Whether to print the report in a concise mode, or not.
- print_settings(description=False, concise=False)[source]
Print out the current settings.
- Parameters:
- descriptionbool, optional, default: False
Whether to print out a description with current settings.
- concisebool, optional, default: False
Whether to print the report in a concise mode, or not.
- report(freqs=None, power_spectrum=None, freq_range=None, plt_log=False, plot_full_range=False, **plot_kwargs)[source]
Run model fit, and display a report, which includes a plot, and printed results.
- Parameters:
- freqs1d array, optional
Frequency values for the power spectrum.
- power_spectrum1d array, optional
Power values, which must be input in linear space.
- freq_rangelist of [float, float], optional
Desired frequency range to fit the model to. If not provided, fits across the entire given range.
- plt_logbool, optional, default: False
Whether or not to plot the frequency axis in log space.
- plot_full_rangebool, default: False
If True, plots the full range of the given power spectrum. Only relevant / effective if freqs and power_spectrum passed in in this call.
- **plot_kwargs
Keyword arguments to pass into the plot method. Plot options with a name conflict be passed by pre-pending ‘plot_’. e.g. freqs, power_spectrum and freq_range.
Notes
Data is optional, if data has already been added to the object.
- save(file_name, file_path=None, append=False, save_results=False, save_settings=False, save_data=False)[source]
Save out data, results and/or settings from a FOOOF object into a JSON file.
- Parameters:
- file_namestr or FileObject
File to save data to.
- file_pathPath or str, optional
Path to directory to save to. If None, saves to current directory.
- appendbool, optional, default: False
Whether to append to an existing file, if available. This option is only valid (and only used) if ‘file_name’ is a str.
- save_resultsbool, optional
Whether to save out FOOOF model fit results.
- save_settingsbool, optional
Whether to save out FOOOF settings.
- save_databool, optional
Whether to save out input data.
- Raises:
- ValueError
If the save file is not understood.
- save_report(file_name, file_path=None, plt_log=False, add_settings=True, **plot_kwargs)[source]
Generate and save out a PDF report for a power spectrum model fit.
- Parameters:
- file_namestr
Name to give the saved out file.
- file_pathPath or str, optional
Path to directory to save to. If None, saves to current directory.
- plt_logbool, optional, default: False
Whether or not to plot the frequency axis in log space.
- add_settingsbool, optional, default: True
Whether to add a print out of the model settings to the end of the report.
- plot_kwargskeyword arguments
Keyword arguments to pass into the plot method.
- set_check_data_mode(check_data)[source]
Set check data mode, which controls if an error is raised if NaN or Inf data are added.
- Parameters:
- check_databool
Whether to run in check data mode.
- set_check_modes(check_freqs=None, check_data=None)[source]
Set check modes, which controls if an error is raised based on check on the inputs.
- Parameters:
- check_freqsbool, optional
Whether to run in check freqs mode, which checks the frequency data.
- check_databool, optional
Whether to run in check data mode, which checks the power spectrum values data.
- set_debug_mode(debug)[source]
Set debug mode, which controls if an error is raised if model fitting is unsuccessful.
- Parameters:
- debugbool
Whether to run in debug mode.