Note
Go to the end to download the full example code.
Frequency-by-Frequency Errors
Check the error of power spectrum models across frequencies.
# Import numpy for some utility functions
import numpy as np

# Import the FOOOF and FOOOFGroup objects
from fooof import FOOOF, FOOOFGroup

# Import simulation utilities to create some test data
from fooof.sim.gen import gen_power_spectrum, gen_group_power_spectra

# Import functions to examine frequency-by-frequency error of model fits
from fooof.analysis.error import compute_pointwise_error_fm, compute_pointwise_error_fg
Frequency-by-Frequency Error
When fitting power spectrum models, one of the goodness-of-fit measures computed and returned is the total error of th full model fit, compared to the original data.
Though potentially useful for evaluating overall performance, this total error measure doesn’t necessarily help to indicate where, in frequency space, or in what ways the model might be going wrong.
To get better insight into the model fitting, here we will explore some utilities that calculate and visualize the frequency-by-frequency error of model fits. This can allow for identifying where in the spectrum is being fit well, or not well.
Checking the Error of Individual Model Fits
First we will start by examining frequency-by-frequency error of an individual model fit, using simulated data.
The function for analyzing error from a FOOOF object is
compute_pointwise_error_fm().
To start with, we will indicate to this function to plot the frequency-by-frequency
error of our model fit.
# Simulate an example power spectrum
freqs, powers = gen_power_spectrum([3, 50], [1, 1], [10, 0.25, 0.5])
# Calculate the error per frequency of the model
compute_pointwise_error_fm(fm, plot_errors=True)
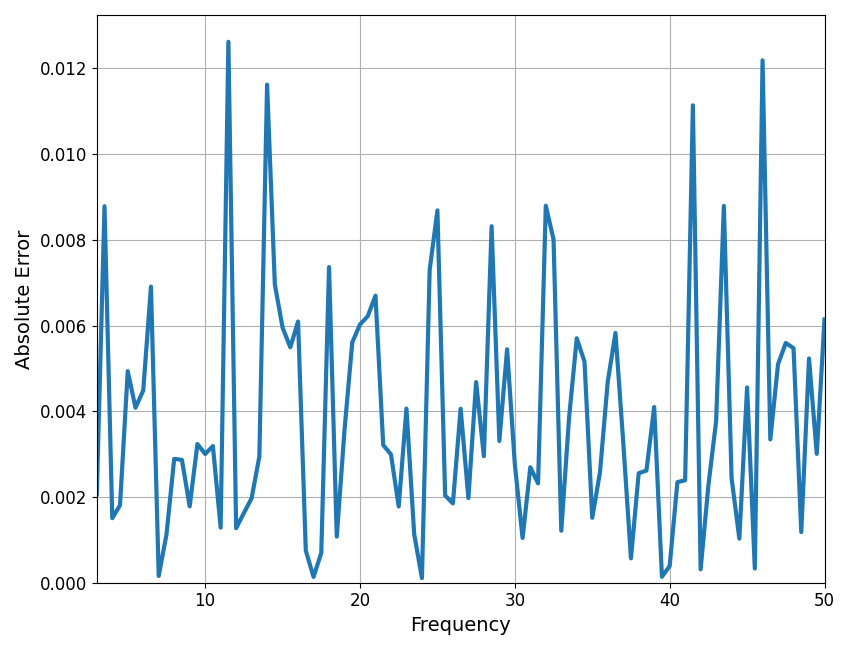
In the above, we can see that error is fairly even, and overall low. This suggests no particular problem with the fit.
You can also calculate and return the frequency-by-frequency errors of a model fit.
# We can also use this function to return the frequency-by-frequency error
errs_fm = compute_pointwise_error_fm(fm, plot_errors=False, return_errors=True)
# Note that the average of this error is the same as the global error stored
print('Average freq-by-freq error:\t {:1.3f}'.format(np.mean(errs_fm)))
print('FOOOF model fit error: \t\t {:1.3f}'.format(fm.error_))
Average freq-by-freq error:      0.004
FOOOF model fit error:           0.004
Checking the Error Across Groups of Model Fits
Next, lets move on to calculating frequency-by-frequency error across groups of fits, again using some simulated data.
To analyze error from a FOOOFGroup object, use compute_pointwise_error_fg().
# Simulate a group of power spectra
freqs, powers = gen_group_power_spectra(10, [3, 50], [1, 1], [10, 0.3, 1], nlvs=0.1)
# Initialize a FOOOFGroup object to fit
fg = FOOOFGroup(min_peak_height=0.25, verbose=False)
# Parameterize our group of power spectra
fg.fit(freqs, powers)
Just as before, we can plot and/or return the error.
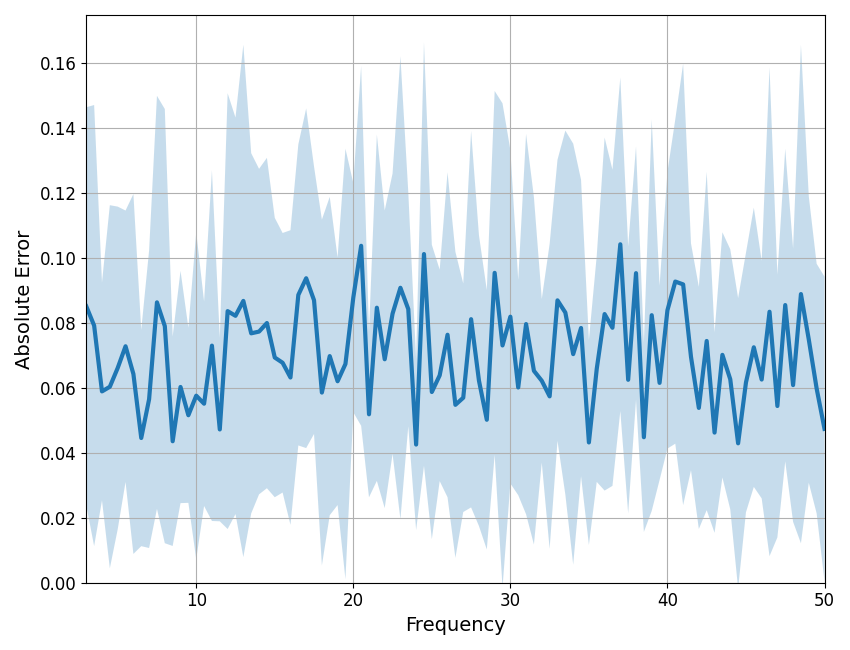
When plotting the error, the plot line is the mean error per frequency, across fits, and the shading indicates the standard deviation of the error, also per frequency.
# Plot the group frequency-by-frequency error
compute_pointwise_error_fg(fg, plot_errors=True)
# Return the errors - this returns a 2D matrix of errors for all fits
errs_fg = compute_pointwise_error_fg(fg, False, True)
# We can check which frequency has highest error, or standard deviation of error
f_max_err = fg.freqs[np.argmax(np.mean(errs_fg, 0))]
f_max_std = fg.freqs[np.argmax(np.std(errs_fg, 0))]

# Print out frequency of maximal error
print('Frequency with highest mean error: \t\t\t', f_max_err)
print('Frequency with highest standard deviation of error: \t', f_max_std)
Frequency with highest mean error:                       7.5
Frequency with highest standard deviation of error:      7.5
In the plot and checks above, we again see that the error is on average low, and that there is no region that stands out as problematic.
Frequency-by-Frequency Errors When There is a Problem
So far we have examined cases in which the models were working well, and the frequency-by-frequency error revealed no big surprises.
As a final example, let’s examine a case in which the model is not working well, and see how the errors look. In particular, we will simulate some new power spectra, with a knee parameter, and refit with the same FOOOFGroup object, in ‘fixed’ aperiodic mode, and then analyze the frequency-by-frequency errors, as before. In this scenario, we are fitting data with the wrong model form, and so we expect there to be some issues with the fit, and we can use the frequency-by-frequency error to investigate if and how this is the case.
# Simulate a group of power spectra, with a knee
freqs, powers = gen_group_power_spectra(10, [1, 50], [0, 10, 2],
                                        [10, 0.3, 1], nlvs=0.01)

# Parameterize our new group of power spectra
fg.fit(freqs, powers)
# Plot the group frequency-by-frequency error
compute_pointwise_error_fg(fg, plot_errors=True)
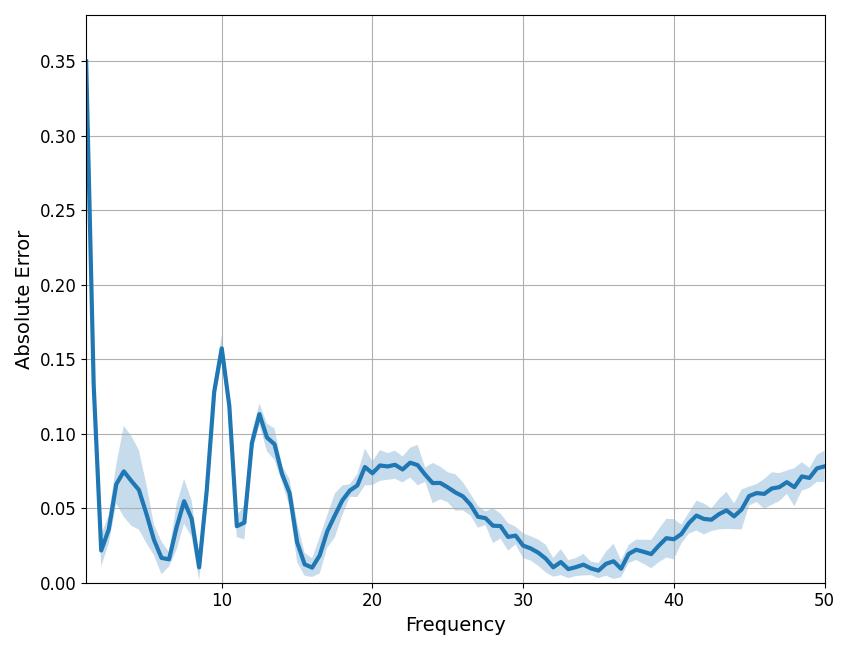
In the plot above, we can see that there is more error in the model, but also that this error is not evenly distributed. The error is uneven across frequencies, and particularly high around the low frequencies. In this case, this is due to a mismatch between the data properties we simulated and the aperiodic mode used to fit the data.
If you see high errors, especially bunched up around particular frequencies, this is a sign that something might be going wrong, and it might be worth looking more into the how the model fits are going.
Total running time of the script: (0 minutes 1.073 seconds)