Note
Go to the end to download the full example code.
06: FOOOFGroup
Using FOOOFGroup to run fit models across multiple power spectra.
# Import the FOOOFGroup object
from fooof import FOOOFGroup

# Import a utility to download and load example data
from fooof.utils.download import load_fooof_data
Fitting Multiple Spectra
So far, we have explored using the FOOOF object to fit individual power spectra.
However, many potential analyses will including many power spectra that need to be fit.
To support this, here we will introduce the FOOOFGroup object, which
applies the model fitting procedure across multiple power spectra.
# Load examples data files needed for this example
freqs = load_fooof_data('group_freqs.npy', folder='data')
spectra = load_fooof_data('group_powers.npy', folder='data')
For parameterizing a group of spectra, we can use a 1d array of frequency values corresponding to a 2d array for power spectra.
This is the organization of the data we just loaded.
# Check the shape of the loaded data
print(freqs.shape)
print(spectra.shape)
(100,)
(25, 100)
FOOOFGroup
The FOOOFGroup object is very similar to the FOOOF object (programmatically,
it inherits from the FOOOF object), and can be used in the same way.
The main difference is that instead of running across a single power spectrum, it operates across 2D matrices containing multiple power spectra.
Note that by ‘group’ we mean merely to refer to a group of power-spectra. We are not using the term ‘group’ in terms of necessarily referring to multiple subjects or any particular idea of what a ‘group’ may be. A group of power spectra could be spectra from across channels, or across trials, or across subjects, or whatever organization makes sense for the analysis at hand.
The main differences with the FOOOFGroup object, are that it uses a
power_spectra attribute, which stores the matrix of power-spectra to be fit,
and collects fit results into a group_results attribute.
Otherwise, FOOOFGroup supports all the same functionality,
accessed in the same way as the FOOOF object.
Internally, it runs the exact same fitting procedure, per spectrum, as the FOOOF object.
# Initialize a FOOOFGroup object, which accepts all the same settings as FOOOF
fg = FOOOFGroup(peak_width_limits=[1, 8], min_peak_height=0.05, max_n_peaks=6)
# Fit a group of power spectra with the .fit() method
#  The key difference (compared to FOOOF) is that it takes a 2D array of spectra
#     This matrix should have the shape of [n_spectra, n_freqs]
fg.fit(freqs, spectra, [3, 30])
Running FOOOFGroup across 25 power spectra.
# Print out results
fg.print_results()
==================================================================================================
FOOOF - GROUP RESULTS
Number of power spectra in the Group: 25
The model was run on the frequency range 3 - 30 Hz
Frequency Resolution is 0.49 Hz
Power spectra were fit without a knee.
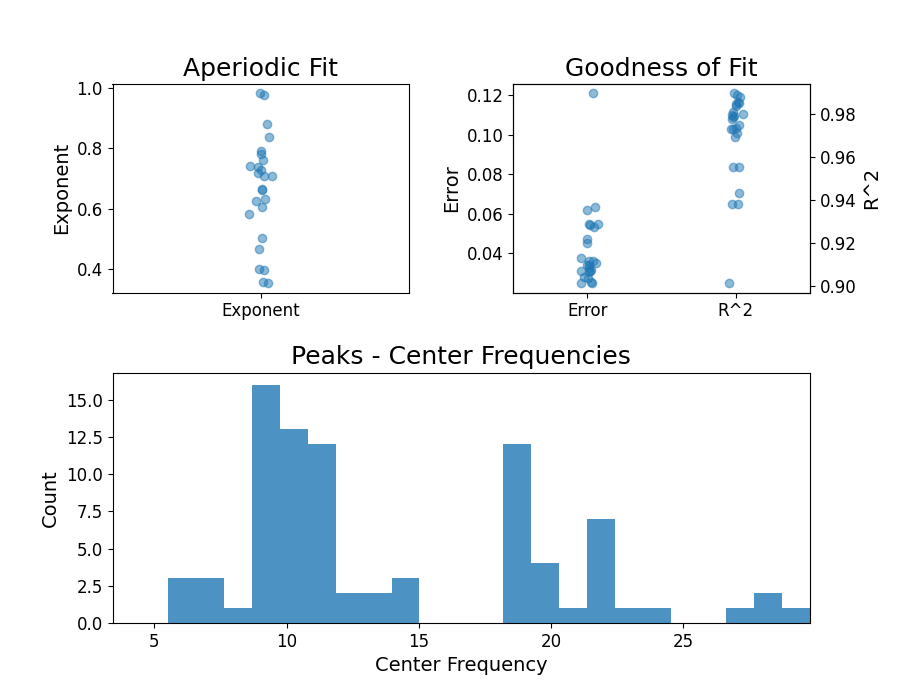
Aperiodic Fit Values:
Exponents - Min: 0.353, Max: 0.982, Mean: 0.664
In total 85 peaks were extracted from the group
Goodness of fit metrics:
R2s - Min: 0.902, Max: 0.990, Mean: 0.970
Errors - Min: 0.025, Max: 0.121, Mean: 0.042
==================================================================================================
# Plot a summary of the results across the group
fg.plot()
Just as with the FOOOF object, you can call the convenience method
fooof.FOOOFGroup.report() to run the fitting, and then print the results and plots.
# You can also save out PDF reports of the FOOOFGroup fits, same as with FOOOF
fg.save_report('FOOOFGroup_report')
FOOOFGroup Results
FOOOFGroup collects fits across power spectra, and stores them in an attribute
called group_results, which is a list of FOOOFResults objects.
# Check out some of the results stored in 'group_results'
print(fg.group_results[0:2])
[FOOOFResults(aperiodic_params=array([-21.59315939,   0.66654702]), peak_params=array([[ 9.4088037 ,  1.44223655,  2.13520588],
       [18.44689677,  0.62328343,  2.36122323]]), r_squared=0.9729477047722165, error=0.05410881223626137, gaussian_params=array([[ 9.4088037 ,  1.45321197,  1.06760294],
       [18.44689677,  0.62588664,  1.18061161]])), FOOOFResults(aperiodic_params=array([-21.64485743,   0.78116379]), peak_params=array([[ 9.34931443,  1.59788754,  2.05215067],
       [11.57383427,  0.44989782,  1.24937296],
       [18.5393173 ,  0.73999236,  2.37682558]]), r_squared=0.979568926997023, error=0.05326551688366744, gaussian_params=array([[ 9.34931443,  1.6014178 ,  1.02607533],
       [11.57383427,  0.34781375,  0.62468648],
       [18.5393173 ,  0.74005425,  1.18841279]]))]
get_params
To collect results from across all model fits, and to select specific parameters
you can use the get_params() method.
This method works the same as in the FOOOF object, and lets you extract
specific results by specifying a field, as a string, and (optionally) a specific column
to extract.
Since the FOOOFGroup object collects results from across multiple model fits,
you should always use get_params() to access model parameters.
The results attributes introduced with the FOOOF object (such as aperiodic_params_ or
peak_params_) do not store results across the group, as they are defined for individual
model fits (and used internally as such by the FOOOFGroup object).
# Extract aperiodic parameters
aps = fg.get_params('aperiodic_params')
exps = fg.get_params('aperiodic_params', 'exponent')

# Extract peak parameters
peaks = fg.get_params('peak_params')
cfs = fg.get_params('peak_params', 'CF')

# Extract goodness-of-fit metrics
errors = fg.get_params('error')
r2s = fg.get_params('r_squared')
# The full list of parameters you can extract is available in the documentation of `get_params`
print(fg.get_params.__doc__)
Return model fit parameters for specified feature(s).

        Parameters
        ----------
        name : {'aperiodic_params', 'peak_params', 'gaussian_params', 'error', 'r_squared'}
            Name of the data field to extract across the group.
        col : {'CF', 'PW', 'BW', 'offset', 'knee', 'exponent'} or int, optional
            Column name / index to extract from selected data, if requested.
            Only used for name of {'aperiodic_params', 'peak_params', 'gaussian_params'}.

        Returns
        -------
        out : ndarray
            Requested data.

        Raises
        ------
        NoModelError
            If there are no model fit results available.
        ValueError
            If the input for the `col` input is not understood.

        Notes
        -----
        When extracting peak information ('peak_params' or 'gaussian_params'), an additional column
        is appended to the returned array, indicating the index of the model that the peak came from.
More information about the parameters you can extract is also documented in the FOOOFResults object.
Model results from parameterizing a power spectrum.

    Parameters
    ----------
    aperiodic_params : 1d array
        Parameters that define the aperiodic fit. As [Offset, (Knee), Exponent].
        The knee parameter is only included if aperiodic is fit with knee.
    peak_params : 2d array
        Fitted parameter values for the peaks. Each row is a peak, as [CF, PW, BW].
    r_squared : float
        R-squared of the fit between the full model fit and the input data.
    error : float
        Error of the full model fit.
    gaussian_params : 2d array
        Parameters that define the gaussian fit(s).
        Each row is a gaussian, as [mean, height, standard deviation].

    Notes
    -----
    This object is a data object, based on a NamedTuple, with immutable data attributes.
# Check out the extracted exponent values
#  Note that this extraction will return an array of length equal to the number of model fits
#    The model fit that each parameter relates to is the index of this array
print(exps)
[0.66654702 0.78116379 0.97596319 0.35626807 0.66222008 0.58348651
 0.76028335 0.46594577 0.70975764 0.60541614 0.73824336 0.39581644
 0.70797692 0.63143897 0.78995515 0.50376859 0.8382523  0.62707642
 0.72882428 0.7186345  0.74302616 0.88147791 0.35305533 0.39947471
 0.98214346]
# Check out some of the fit center-frequencies
#  Note when you extract peak parameters, an extra column is returned,
#  specifying which model fit it came from
print(cfs[0:10, :])
[[ 9.4088037   0.        ]
 [18.44689677  0.        ]
 [ 9.34931443  1.        ]
 [11.57383427  1.        ]
 [18.5393173   1.        ]
 [ 9.48181063  2.        ]
 [11.25615364  2.        ]
 [12.5727178   2.        ]
 [18.67595773  2.        ]
 [10.61406526  3.        ]]
Saving & Loading with FOOOFGroup
FOOOFGroup also support saving and loading, with the same options for saving out different things as defined and described for the FOOOF object.
The only difference in saving FOOOFGroup, is that it saves out a ‘jsonlines’ file, in which each line is a JSON object, saving the specified data, settings, and results for a single power spectrum.
# Save out FOOOFGroup settings & results
fg.save('FG_results', save_settings=True, save_results=True)
# You can then reload this group
nfg = FOOOFGroup()
nfg.load('FG_results')
# Print results to check that the loaded group
nfg.print_results()
==================================================================================================

                                       FOOOF - GROUP RESULTS

                             Number of power spectra in the Group: 25

                        The model was run on the frequency range 3 - 30 Hz
                                 Frequency Resolution is 0.49 Hz

                              Power spectra were fit without a knee.

                                      Aperiodic Fit Values:
                        Exponents - Min:  0.353, Max:  0.982, Mean: 0.664

                         In total 85 peaks were extracted from the group

                                     Goodness of fit metrics:
                            R2s -  Min:  0.902, Max:  0.990, Mean: 0.970
                         Errors -  Min:  0.025, Max:  0.121, Mean: 0.042

==================================================================================================
Parallel Support
FOOOFGroup also has support for running in parallel, which can speed things up, since each power spectrum can be fit independently.
The fit method includes an optional parameter n_jobs, which if set at 1 (as default),
will fit models linearly (one at a time, in order). If you set this parameter to some other
integer, fitting will launch ‘n_jobs’ number of jobs, in parallel. Setting n_jobs to -1 will
launch model fitting in parallel across all available cores.
Note, however, that fitting power spectrum models in parallel does not guarantee a quicker runtime overall. The computation time per model fit scales with the frequency range fit over, and the ‘complexity’ of the power spectra, in terms of number of peaks. For relatively small numbers of power spectra (less than ~100), across relatively small frequency ranges (say ~3-40Hz), running in parallel may offer no appreciable speed up.
# Fit power spectrum models across a group of power spectra in parallel, using all cores
fg.fit(freqs, spectra, n_jobs=-1)
Running FOOOFGroup across 25 power spectra.
Progress Bar
If you have a large number of spectra to fit with a FOOOFGroup, and you
want to monitor it’s progress, you can also use a progress bar to print out fitting progress.
Progress bar options are:
tqdm: a progress bar for running in terminalstqdm.notebook: a progress bar for running in Jupyter notebooks
# Fit power spectrum models across a group of power spectra, printing a progress bar
fg.fit(freqs, spectra, progress='tqdm')
Running FOOOFGroup:   0%|          | 0/25 [00:00<?, ?it/s]
Running FOOOFGroup:  16%|█▌        | 4/25 [00:00<00:00, 35.27it/s]
Running FOOOFGroup:  32%|███▏      | 8/25 [00:00<00:00, 23.09it/s]
Running FOOOFGroup:  44%|████▍     | 11/25 [00:00<00:00, 24.00it/s]
Running FOOOFGroup:  60%|██████    | 15/25 [00:00<00:00, 28.28it/s]
Running FOOOFGroup:  76%|███████▌  | 19/25 [00:00<00:00, 16.73it/s]
Running FOOOFGroup:  88%|████████▊ | 22/25 [00:01<00:00, 18.45it/s]
Running FOOOFGroup: 100%|██████████| 25/25 [00:01<00:00, 21.40it/s]
Extracting Individual Fits
When fitting power spectrum models for a group of power spectra, results are stored in FOOOFResults objects, which store (only) the results of the model fit, not the full model fits themselves.
To examine individual model fits, FOOOFGroup can regenerate
FOOOF objects for individual power spectra, with the full model available
for visualization. To do so, you can use the get_fooof() method.
# Extract a particular spectrum, specified by index
#  Here we also specify to regenerate the the full model fit, from the results
fm = fg.get_fooof(ind=2, regenerate=True)
# Print results and plot extracted model fit
fm.print_results()
fm.plot()
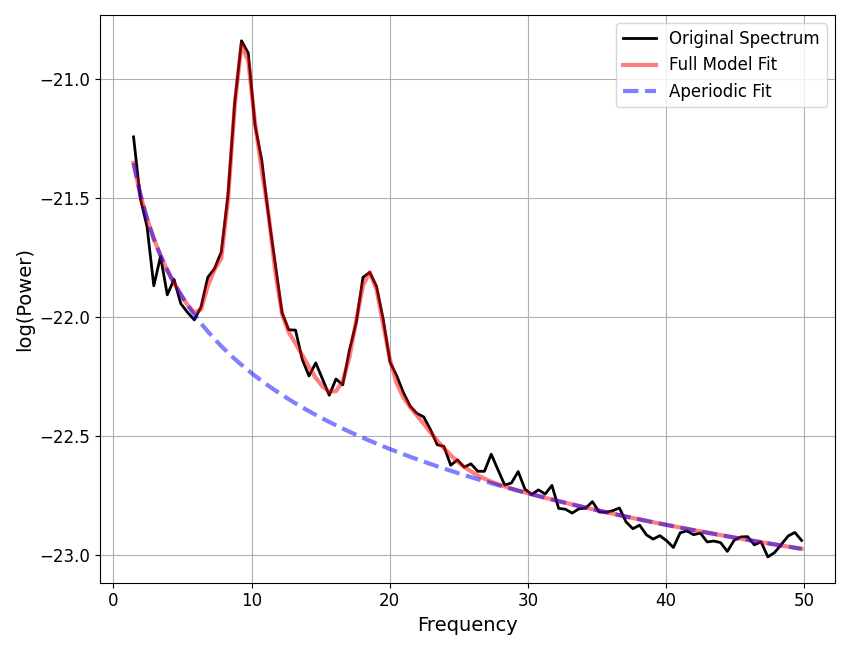
==================================================================================================

                                   FOOOF - POWER SPECTRUM MODEL

                        The model was run on the frequency range 1 - 50 Hz
                                 Frequency Resolution is 0.49 Hz

                            Aperiodic Parameters (offset, exponent):
                                         -21.1789, 1.0581

                                       6 peaks were found:
                                CF:   7.18, PW:  0.292, BW:  1.00
                                CF:   9.38, PW:  1.347, BW:  1.74
                                CF:  11.07, PW:  0.722, BW:  1.17
                                CF:  12.17, PW:  0.340, BW:  3.82
                                CF:  18.50, PW:  0.708, BW:  1.90
                                CF:  19.97, PW:  0.376, BW:  5.52

                                     Goodness of fit metrics:
                                    R^2 of model fit is 0.9940
                                    Error of the fit is 0.0304

==================================================================================================
Conclusion
Now we have explored fitting power spectrum models and running these fits across multiple power spectra. Next we dig deeper into how to choose and tune the algorithm settings, and how to troubleshoot if any of the fitting seems to go wrong.
Total running time of the script: (0 minutes 8.166 seconds)