Note
Go to the end to download the full example code.
Periodic Parameters
Exploring properties and topics related to peak parameters.
from fooof import FOOOF, FOOOFGroup
from fooof.plts.spectra import plot_spectra
from fooof.plts.periodic import plot_peak_params
from fooof.sim.utils import set_random_seed
from fooof.sim.params import Stepper, param_iter
from fooof.sim import gen_power_spectrum, gen_group_power_spectra
from fooof.plts.annotate import plot_annotated_model
from fooof.utils.params import compute_time_constant, compute_knee_frequency
Gaussian Peak Model
By default, the spectral parameterization model fits Gaussians to any detected peaks.
These Gaussians are defined by a mean, height, and standard deviation, which we in turn interpret as the center frequency (CF), power (PW), and bandwidth (BW) of the putative oscillation.
In this example, we will further explore these peak parameters and some topics and limitations related to their use and interpretations.
# Simulate an example power spectrum
freqs, powers = gen_power_spectrum([3, 40], [0, 1], [10, 0.3, 1.], freq_res=0.25)
# Plot annotated model labelling the peaks
plot_annotated_model(fm, annotate_peaks=True, annotate_aperiodic=False, plt_log=True)
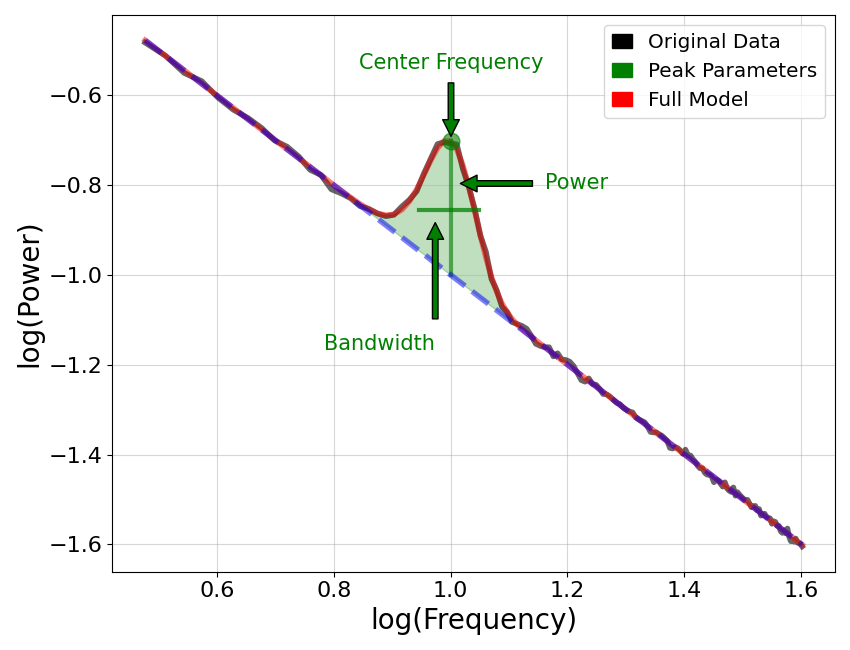
In the above we can see an example of the fit peak parameters
Overlapping Peaks
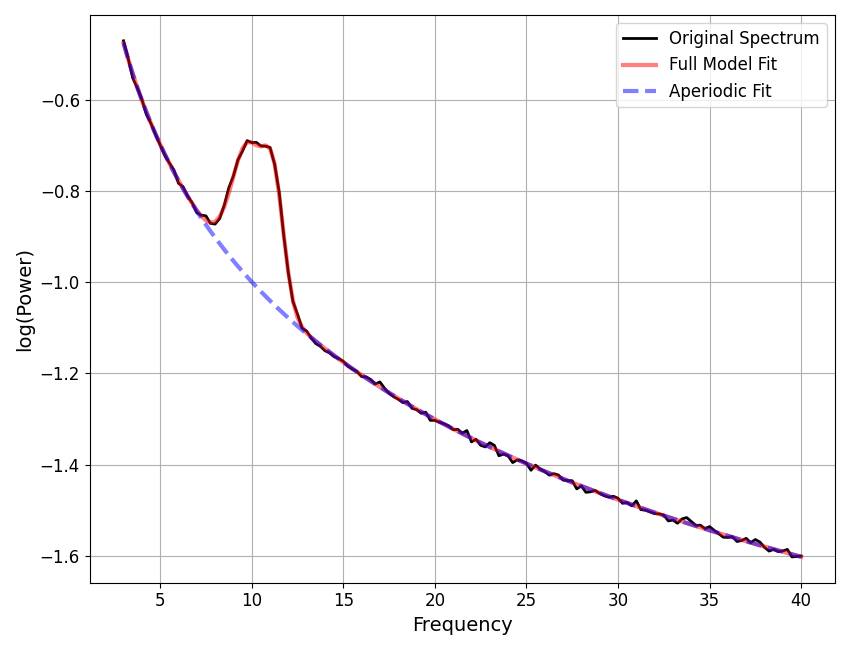
Let’s now consider some features of fitting Gaussian peaks, and how this relates to the neural data under study. In particular, Gaussian’s are symmetric and while they do seem to approximate the peaks we observe in emprical data quite well, not all peaks in empirical power spectra are quite symmetric.
To deal with this, the model sometimes fits overlapping peaks, whereby two or more peaks are used by the model to capture the shape of what otherwise looks like a single peak.
We can explore this in a simplified simulation.
# Set the random seed
set_random_seed(10)
# Simulate an example power spectrum created with an asymmetric peak
freqs, powers = gen_power_spectrum([3, 40], [0, 1], [[10, 0.3, 1.], [11.25, 0.175, 0.5]], freq_res=0.25)
==================================================================================================

                                   FOOOF - POWER SPECTRUM MODEL

                        The model was run on the frequency range 3 - 40 Hz
                                 Frequency Resolution is 0.25 Hz

                            Aperiodic Parameters (offset, exponent):
                                          0.0024, 1.0014

                                       2 peaks were found:
                                CF:   9.86, PW:  0.295, BW:  1.80
                                CF:  11.23, PW:  0.310, BW:  1.10

                                     Goodness of fit metrics:
                                    R^2 of model fit is 0.9998
                                    Error of the fit is 0.0037

==================================================================================================
As we can see in the above model solution, in the data, it looks like there is a single oscillatory peak, and yet the model has captured this peak with two Gaussians.
This example serves to demonstrate two key points. First, not all Gaussians fit in the model necessary reflect separate peaks, as some may overlap. Second, when peaks overlap, the parameters of each individually may accurately capture a peak in the data, as the overall shape of the peak may be captured as the interaction across multiple Gaussians (this is most common / notable for the bandwidth measure, whereby the width of the peak is best described as the combined width of the two adjacent peaks).
Note that, by construction, this simulated example was created by simulating two overlapping peaks, and so in that sense the model is actually correct in it’s solution. In empirical data, we do not know if a power spectrum that looks like this does reflect two underlying oscillatory processes, or perhaps a single oscillatory process that happens to be asymmetric in the frequency domain.
Total running time of the script: (0 minutes 0.441 seconds)