fooof.plts.annotate.plot_annotated_model
- fooof.plts.annotate.plot_annotated_model(fm, plt_log=False, annotate_peaks=True, annotate_aperiodic=True, ax=None)[source]
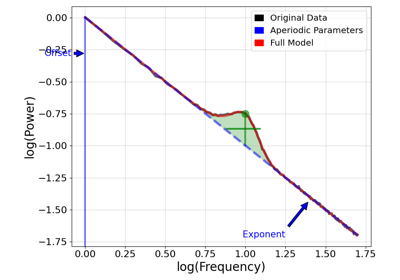
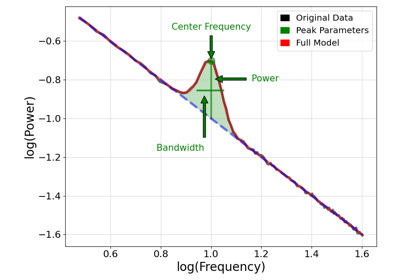
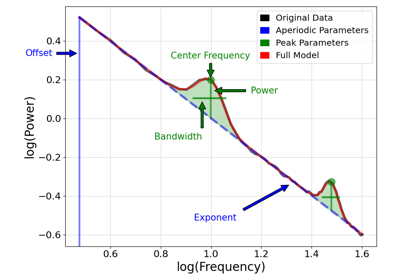
Plot a an annotated power spectrum and model, from a FOOOF object.
- Parameters:
- fmFOOOF
FOOOF object, with model fit, data and settings available.
- plt_logboolean, optional, default: False
Whether to plot the frequency values in log10 spacing.
- annotate_peaksboolean, optional, default: True
Whether to annotate the periodic components of the model fit.
- annotate_aperiodicboolean, optional, default: True
Whether to annotate the aperiodic components of the model fit.
- axmatplotlib.Axes, optional
Figure axes upon which to plot.
- Raises:
- NoModelError
If there are no model results available to plot.