Note
Go to the end to download the full example code.
Fitting Power Spectrum Models Across 3D Arrays
Fitting power spectrum models across 3D arrays of power spectra.
Running Across 3D
Most of the materials so far have explored using the FOOOF object to fit
individual power spectra, and the FOOOFGroup object for fitting groups of
power spectra, where a group of spectra is organized as a 2D array of power spectra.
In this example, we’ll go one step further, and step through how to analyze data organized into 3D arrays.
Organizing Data into 3D Objects
Electrophysiological data typically has multiple dimensions including, for example, the number of subjects, the number of channels and/or recording regions, the number of conditions, and/or the number of trials.
This often means that we organize our data into multi-dimensional arrays.
So, for example, a 3D array of power spectra could reflect:
power spectra across task conditions, as [n_conditions, n_channels, n_freqs]
power spectra across data epochs within subjects, as [n_epochs, n_channels, n_freqs]
power spectra across a group of subjects, as [n_subjects, n_channels, n_freqs]
power spectra across regions, as [n_regions, n_channels, n_freqs]
If you do have data that is or can be organized into 3D arrays, here we will explore how to fit, manage, and organize this data.
A reminder that no matter how the data is organized, it’s always the exact same model that is fit, that is the one defined in the FOOOF object. All other objects or organizations use this same code to do the fitting. For example, the FOOOFGroup object inherits from the FOOOF, and calls the same underlying fit function.
As we’ll see, we can fit 3D arrays of spectra by distributing FOOOFGroup objects across the data, which also uses the same underlying code.
# Imports for helping with managing our simulated data and results
import os
import numpy as np

# Import the FOOOFGroup object
from fooof import FOOOFGroup

# Import utilities for working with FOOOF objects
from fooof.objs import fit_fooof_3d, combine_fooofs

# Import simulation & IO utilities to help with the example
from fooof.sim.gen import gen_freqs, gen_group_power_spectra
from fooof.sim.params import param_sampler
from fooof.utils.io import load_fooofgroup
Example Set-Up
For this example, lets imagine we have set up an experiment in which we have recorded data across several different ‘conditions’, from multiple ‘channels’.
When managing our time series, we might organize this data as something like: [n_conditions, n_channels, n_times]
After calculating power spectra, this would become a 3D array of: [n_conditions, n_channels, n_freqs]
For this example, we will use simulated data to explore this example case.
First, we’ll set up the simulations to create some data.
# Define the frequency range of our data
freq_range = [3, 40]
freq_res = 0.25

# Set up the shape of the data
n_conditions = 3
n_channels = 10
n_freqs = len(gen_freqs(freq_range, freq_res))

# Define parameters for the simulated power spectra
ap_opts = param_sampler([[0, 1.0], [0, 1.5], [0, 2]])
pe_opts = param_sampler([[], [10, 0.25, 1], [10, 0.25, 1, 20, 0.15, 1]])
# Generate some simulated power spectra, and organize into a 3D array
spectra = []
for ind in range(n_conditions):
    freqs, powers = gen_group_power_spectra(n_channels, freq_range, ap_opts,
                                            pe_opts, freq_res=freq_res)
    spectra.append(powers)

# Convert collected spectra into a numpy array
spectra = np.array(spectra)
# Check the shape of the spectra
#   Note that this should reflect [n_conditions, n_channels, n_freqs]
print('Shape of the spectra object: \t\t\t{}, {}, {}'.format(*spectra.shape))
print('Number of conditions, channels & frequencies: \t{}, {}, {}'.format(\
    n_conditions, n_channels, n_freqs))
Shape of the spectra object:                    3, 10, 149
Number of conditions, channels & frequencies:   3, 10, 149
Fitting Multiple Power Spectra
The goal, for fitting all these power spectra, is to apply our power spectrum model efficiently across all power spectra, while keeping our data and results organized in a way that we keep track of which model results reflect which data.
The strategy we will take to do so is by systematically applying FOOOF objects across the data.
For working with 3D arrays of power spectra, we have the fit_fooof_3d()
function which takes in data and a pre-initialized model object, and uses it to fit
power spectrum models across all the data, while maintaining the organization of
the input data.
fit_fooof_3d
More specifically, fit_fooof_3d() takes in:
a FOOOFGroup object, pre-initialized with the desired settings
an array of frequency values and a 3D array of power spectra
Internally, this function uses the FOOOFGroup object to
fit models across the power spectra.
This function then returns a list of FOOOFGroup objects, which
collectively store all the model fit results.
# Initialize a FOOOFGroup object, with desired settings
fg = FOOOFGroup(peak_width_limits=[1, 6], min_peak_height=0.1)
# Fit the 3D array of power spectra
fgs = fit_fooof_3d(fg, freqs, spectra)
Running FOOOFGroup across 30 power spectra.
# This returns a list of FOOOFGroup objects
print(fgs)
[<fooof.objs.group.FOOOFGroup object at 0x7fe3878acd90>, <fooof.objs.group.FOOOFGroup object at 0x7fe3878acf40>, <fooof.objs.group.FOOOFGroup object at 0x7fe3878ac130>]
Note that the length of the returned list of objects should be equivalent to the outermost dimensionality of the input data.
In our example setup, this corresponds to n_conditions FOOOFGroup objects.
print('Number of FOOOFGroups: \t{}'.format(len(fgs)))
print('Number of conditions: \t{}'.format(n_conditions))
Number of FOOOFGroups:  3
Number of conditions:   3
Analyzing FOOOF Objects
Once you have fit the power spectrum models, you want to analyze the results in some way!
Since you have a collection of FOOOF objects, you can analyze these the same
way as you would look into any other FOOOF objects. You can check out the other examples
and tutorials for more information on how to do this.
A general strategy for analyzing model fit results as they get returned from
fit_fooof_3d() is to loop across all the objects in the
returned list, and then within the loop you can collect and/or analyze and/or plot
any data of interest.
For a simple example analysis here, we can investigate if there appears to be a difference in aperiodic exponent between different conditions.
# Compare the aperiodic exponent results across conditions
for ind, fg in enumerate(fgs):
    print("Aperiodic exponent for condition {} is {:1.4f}".format(
        ind, np.mean(fg.get_params('aperiodic_params', 'exponent'))))
Aperiodic exponent for condition 0 is 1.3008
Aperiodic exponent for condition 1 is 1.6004
Aperiodic exponent for condition 2 is 1.7004
Managing FOOOF Objects
When running analyses like this, you may start to have many FOOOF objects.
For example, you may want to save them out, reload them as needed, and analyze
results from each FOOOF or FOOOFGroup object.
You may also manipulate the objects by, for example, combining model results
across objects to check overall model fit properties.
Here, we will continue with a quick example of saving, loading and then combining FOOOF objects. Note that a broader exploration of managing different FOOOF objects and these object utility functions is available in other examples.
# Check for and create a 'results' directory, to save out data to
if not os.path.isdir('results'):
    os.mkdir('results')

# Save out results, storing each as with a file name based on the condition
for ind, fg in enumerate(fgs):
    fg.save('subj_01_cond_0' + str(ind), file_path='results', save_results=True)
# Reload our list of FOOOFGroups
fgs = [load_fooofgroup(file_name, file_path='results') \
    for file_name in os.listdir('results')]
# Combine a list of FOOOF objects into a single FOOOFGroup object
all_fg = combine_fooofs(fgs)

# Explore the results from across all model fits
all_fg.print_results()
all_fg.plot()
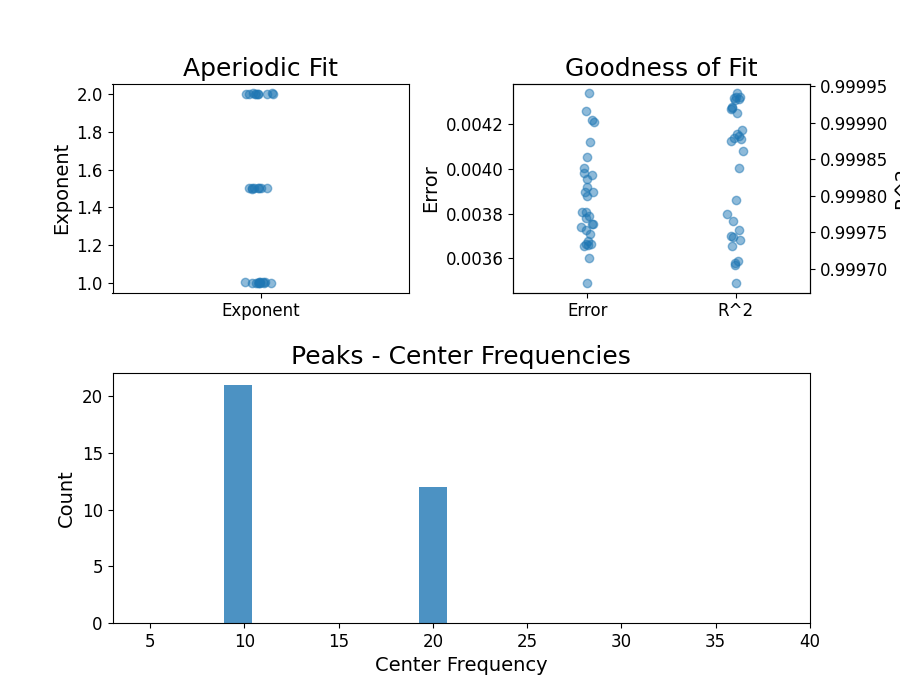
==================================================================================================

                                       FOOOF - GROUP RESULTS

                             Number of power spectra in the Group: 30

                        The model was run on the frequency range 3 - 40 Hz
                                 Frequency Resolution is 0.25 Hz

                              Power spectra were fit without a knee.

                                      Aperiodic Fit Values:
                        Exponents - Min:  0.999, Max:  2.003, Mean: 1.534

                         In total 31 peaks were extracted from the group

                                     Goodness of fit metrics:
                            R2s -  Min:  1.000, Max:  1.000, Mean: 1.000
                         Errors -  Min:  0.004, Max:  0.005, Mean: 0.004

==================================================================================================
Total running time of the script: (0 minutes 0.354 seconds)