fooof.plts.periodic.plot_peak_fits
- fooof.plts.periodic.plot_peak_fits(peaks, freq_range=None, colors=None, labels=None, ax=None, **plot_kwargs)[source]
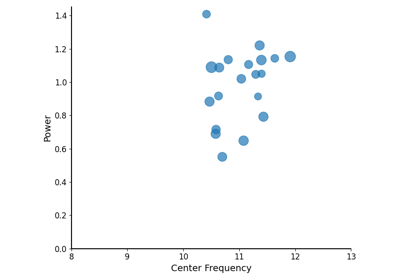
Plot reconstructions of model peak fits.
- Parameters:
- peaks2d array
Peak data. Each row is a peak, as [CF, PW, BW].
- freq_rangelist of [float, float] , optional
The frequency range to plot the peak fits across, as [f_min, f_max]. If not provided, defaults to +/- 4 around given peak center frequencies.
- colorsstr or list of str, optional
Color(s) to plot data.
- labelslist of str, optional
Label(s) for plotted data, to be added in a legend.
- axmatplotlib.Axes, optional
Figure axes upon which to plot.
- **plot_kwargs
Keyword arguments to pass into the plot call.