fooof.utils.interpolate_spectrum
- fooof.utils.interpolate_spectrum(freqs, powers, interp_range, buffer=3)[source]
Interpolate a frequency region in a power spectrum.
- Parameters:
- freqs1d array
Frequency values for the power spectrum.
- powers1d array
Power values for the power spectrum.
- interp_rangelist of float or list of list of float
Frequency range to interpolate, as [lowest_freq, highest_freq]. If a list of lists, applies each as it’s own interpolation range.
- bufferint or list of int
The number of samples to use on either side of the interpolation range, that are then averaged and used to calculate the interpolation.
- Returns:
- freqs1d array
Frequency values for the power spectrum.
- powers1d array
Power values, with interpolation, for the power spectrum.
Notes
This function takes in, and returns, linearly spaced values.
This approach interpolates data linearly, in log-log spacing. This assumes a 1/f property of the data, and so should only be applied where this assumption is valid. This approach is intended for interpolating small frequency ranges, such as line noise regions.
The interpolation range is taken as the range from >= interp_range_low and <= interp_range_high. It does not round to below or above interp_range_low and interp_range_high, respectively.
To be more robust to noise, this approach takes a number of samples on either side of the interpolation range (the number of which is controlled by buffer) and averages these points to linearly interpolate between them. Setting buffer=1 is equivalent to a linear interpolation between the points adjacent to the interpolation range.
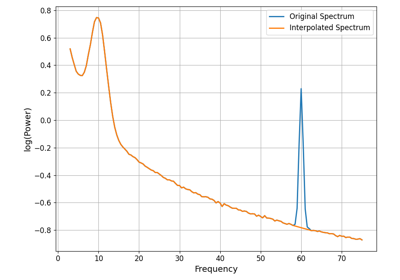
Examples
Using a simulated spectrum, interpolate away a line noise peak:
>>> from fooof.sim import gen_power_spectrum
>>> freqs, powers = gen_power_spectrum([1, 75], [1, 1], [[10, 0.5, 1.0], [60, 2, 0.1]])
>>> freqs, powers = interpolate_spectrum(freqs, powers, [58, 62])