Note
Go to the end to download the full example code.
Simulating Neural Power Spectra
Creating simulated power spectra.
# Import functions for creating simulated power spectra
from fooof.sim.gen import gen_power_spectrum, gen_group_power_spectra

# Import plotting functions
from fooof.plts.spectra import plot_spectra
Creating Simulated Power Spectra
The module also contains utilities to create simulated power spectra. Power spectra are simulated using the same model and conception that the model employs, namely that neural power spectra can be conceptualized as an aperiodic component, with overlying periodic peaks.
To simulate power spectra, required parameters are:
freq_range: the frequency range to simulate acrossaperiodic_params: parameters that define the aperiodic componentthis component is defined with 2 or 3 parameters, as [offset, (knee), exponent]
gaussian_params: parameters that define the periodic componenteach peak is defined with three parameters, as [center frequency, height, width]
The gen_power_spectrum() function takes these parameters as input to
create and return a simulated power spectrum. Note that the parameters that define the peaks
are labeled as gaussian parameters, as these parameters define the simulated gaussians
directly, and are not the modified peak parameters that the model outputs.
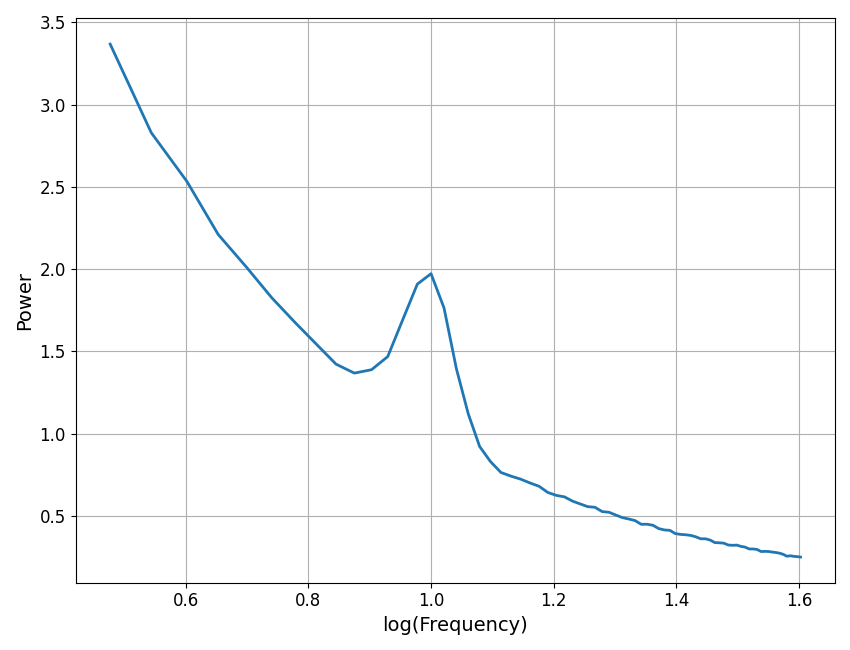
# Settings & parameters for creating a simulated power spectrum
freq_range = [3, 40]              # The frequency range to simulate
aperiodic_params = [1, 1]         # Parameters defining the aperiodic component
periodic_params = [10, 0.3, 1]    # Parameters for any periodic components
# Generate a simulated power spectrum
freqs, powers = gen_power_spectrum(freq_range, aperiodic_params, periodic_params)
# Plot the simulated power spectrum
plot_spectra(freqs, powers, log_freqs=True, log_powers=False)
Simulating With Different Parameters
Power spectra can be simulated with any desired parameters in the power spectrum model.
The aperiodic mode for the simulated power spectrum is inferred from the parameters provided. If two parameters are provided, this is interpreted as [offset, exponent] for simulating a power spectra with a ‘fixed’ aperiodic component. If three parameters are provided, as in the example below, this is interpreted as [offset, knee, exponent] for a ‘knee’ spectrum.
Power spectra can also be simulated with any number of peaks. Peaks can be listed in a flat list with [center frequency, height, bandwidth] listed for as many peaks as you would like to add, or as a list of lists containing the same information.
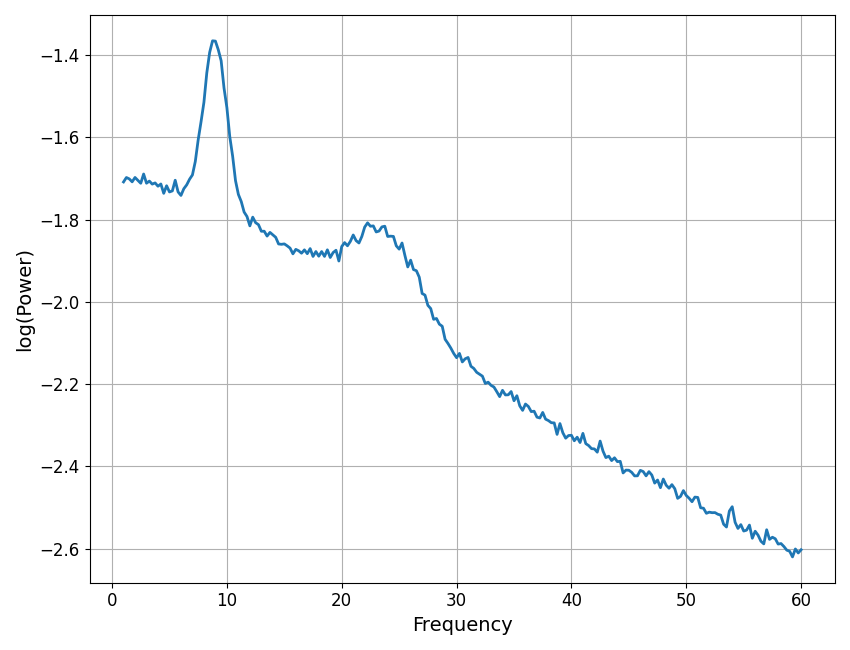
The following example shows simulating a different power spectrum with some different setttings, also changing the noise level added to the spectrum, and the frequency resolution of the simulated spectrum.
# Define the frequency range to simulate across
freq_range = [1, 60]
# Define the frequency resolution to simulate with
freq_res = 0.25
# Define the amount of noise to add to the spectrum
nlv = 0.01

# Define aperiodic params, as [offset, knee, exponent]
aperiodic_params = [1, 500, 2]

# Define periodic params, as a flat list of [CF, PW, BW] for each peak
#   This could also be written as [[9, 0.4, 1], [24, 0.2, 3]]
periodic_params = [9, 0.4, 1, 24, 0.2, 3]
# Generate the new simulated power spectrum
freqs, powers = gen_power_spectrum(freq_range, aperiodic_params,
                                   periodic_params, nlv, freq_res)
# Plot the new simulated power spectrum
plot_spectra(freqs, powers, log_powers=True)
Simulating a Group of Power Spectra
For simulating multiple power spectra, the gen_group_power_spectra() can be used.
This function takes the same kind of parameter definitions as
gen_power_spectrum(), and in addition takes a number specifying
how many power spectra to simulate, returning a 2D matrix containing the
desired number of spectra.
Parameters that are passed into gen_group_power_spectra() can be:
a single definition, whereby the same value is used for all generated spectra
a list of parameters, whereby each successive entry is used for each successive spectrum
a function or generator that can be called to return parameters for each spectrum
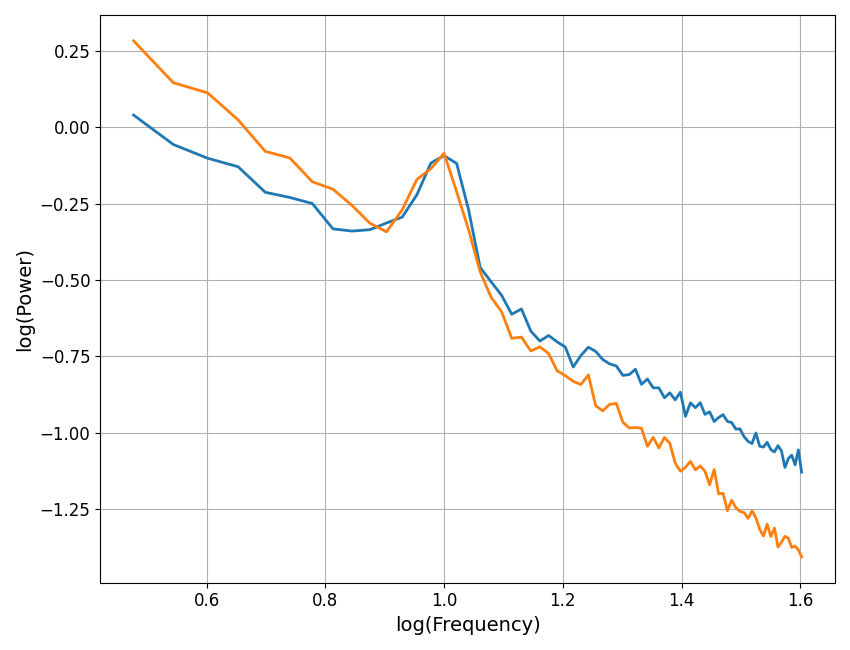
# Create some new settings for simulating a group of power spectra
n_spectra = 2
freq_range = [3, 40]
nlv = 0.02

# Aperiodic params: define values for each spectrum, with length equal to n_spectra
aperiodic_params = [[0.5, 1], [1, 1.5]]

# Periodic parameters: define a single definition, to be applied to all spectra
periodic_params = [10, 0.4, 1]
# Simulate a group of power spectra
freqs, powers = gen_group_power_spectra(n_spectra, freq_range, aperiodic_params,
                                        periodic_params, nlv)
# Plot the power spectra that were just generated
plot_spectra(freqs, powers, log_freqs=True, log_powers=True)
Tracking Simulation Parameters
When you start simulating multiple power spectra across different parameters, you may want to keep track of these parameters, so that you can compare any measure taken on these power spectra to ground truth values.
When simulating power spectra, you also have the option of returning SimParams objects that keep track of the simulation parameters.
# Simulate a power spectrum, returning the simulation parameter information
freqs, powers, sp = gen_power_spectrum([1, 50], [1, 1], [10, 0.25, 1.5],
                                       0.01, return_params=True)

# Check the information stored in the simulation params object
print(sp)
SimParams(aperiodic_params=[1, 1], periodic_params=[[10, 0.25, 1.5]], nlv=0.01)
# Simulate a group of power spectrum, returning the simulation parameter information
freqs, powers, sps = gen_group_power_spectra(3, [1, 150], [1, 100, 150],
                                             [4, 0.2, 2, 22, 0.15, 3],
                                             0.01, return_params=True)

# Check the information stored in the simulation params object
print(sps)
/Users/tom/opt/anaconda3/lib/python3.8/site-packages/fooof/core/funcs.py:67: RuntimeWarning: overflow encountered in power
  ys = ys + offset - np.log10(knee + xs**exp)
/Users/tom/opt/anaconda3/lib/python3.8/site-packages/fooof/core/funcs.py:67: RuntimeWarning: overflow encountered in power
  ys = ys + offset - np.log10(knee + xs**exp)
/Users/tom/opt/anaconda3/lib/python3.8/site-packages/fooof/core/funcs.py:67: RuntimeWarning: overflow encountered in power
  ys = ys + offset - np.log10(knee + xs**exp)
[SimParams(aperiodic_params=[1, 100, 150], periodic_params=[[4, 0.2, 2], [22, 0.15, 3]], nlv=0.01), SimParams(aperiodic_params=[1, 100, 150], periodic_params=[[4, 0.2, 2], [22, 0.15, 3]], nlv=0.01), SimParams(aperiodic_params=[1, 100, 150], periodic_params=[[4, 0.2, 2], [22, 0.15, 3]], nlv=0.01)]
More description of the SimParams object, and other utilities to manage parameters for simulating groups of power spectra can be found in the Simulation Parameters example.
Total running time of the script: (0 minutes 0.444 seconds)