Note
Go to the end to download the full example code.
Simulation Parameters
Manage parameters for creating simulated power spectra.
# Import simulation functions for creating spectra
from fooof.sim.gen import gen_power_spectrum, gen_group_power_spectra

# Import simulation utilities for managing parameters
from fooof.sim.params import param_sampler, param_iter, param_jitter, Stepper

# Import plotting functions to visualize spectra
from fooof.plts.spectra import plot_spectra
Simulation Parameters
One of the useful things about using simulated data is being able to compare results to ground truth values - but in order to do that, one needs to keep track of the simulation parameters themselves.
To do so, there is the SimParams object to manage
and keep track of simulation parameters.
For example, when you simulate power spectra, the parameters for each spectrum are stored
in a SimParams object, and then these objects are collected and returned.
SimParams objects are named tuples with the following fields:
aperiodic_paramsperiodic_paramsnlv
# Set up settings for simulating a group of power spectra
n_spectra = 2
freq_range = [3, 40]
ap_params = [[0.5, 1], [1, 1.5]]
pe_params = [[10, 0.4, 1], [10, 0.2, 1, 22, 0.1, 3]]
nlv = 0.02
# Simulate a group of power spectra
freqs, powers, sim_params = gen_group_power_spectra(n_spectra, freq_range, ap_params,
                                                    pe_params, nlv, return_params=True)
SimParams(aperiodic_params=[0.5, 1], periodic_params=[[10, 0.4, 1]], nlv=0.02)
SimParams(aperiodic_params=[1, 1.5], periodic_params=[[10, 0.2, 1], [22, 0.1, 3]], nlv=0.02)
# You can also use a SimParams object to regenerate a particular power spectrum
cur_params = sim_params[0]
freqs, powers = gen_power_spectrum(freq_range, *cur_params)
Managing Parameters
There are also helper functions for managing and selecting parameters for simulating groups of power spectra.
These functions include:
param_sampler()which can be used to sample parameters from possible optionsparam_iter()which can be used to iterate across parameter rangesparam_jitter()which can be used to add some ‘jitter’ to simulation parameters
param_sampler
The param_sampler() function takes a list of parameter options and
randomly selects from the parameters to create each power spectrum. You can also optionally
specify the probabilities with which to sample from the options.
# Create a sampler to choose from two options for aperiodic parameters
ap_opts = param_sampler([[1, 1.25], [1, 1]])

# Create sampler to choose from two options for periodic parameters, and specify probabilities
pe_opts = param_sampler([[10, 0.5, 1], [[10, 0.5, 1], [20, 0.25, 2]]],
                        probs=[0.75, 0.25])
# Generate some power spectra, using param_sampler
freqs, powers = gen_group_power_spectra(10, freq_range, ap_opts, pe_opts)
# Plot some of the spectra that were generated
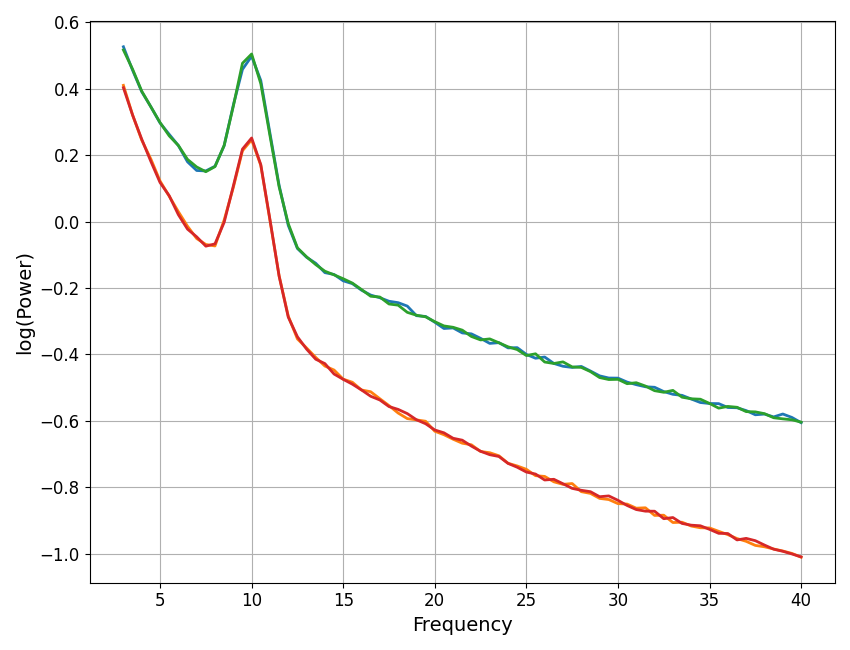
plot_spectra(freqs, powers[0:4, :], log_powers=True)

param_iter
The param_iter() function can be used to create iterators that
can ‘step’ across a range of parameter values to be simulated.
The Stepper object needs to be used in conjunction with
param_iter(), as it specifies the values to be iterated across.
# Set the aperiodic parameters to be stable
ap_params = [1, 1]

# Use a stepper object to define the range of values to step across
#   Stepper is defined with `start, stop, step`
#   Here we'll define a step across alpha center frequency values
cf_steps = Stepper(8, 12, 1)

# We can use use param_iter, with our Stepper object, to create the full peak params
#   The other parameter values will be held constant as we step across CF values
pe_params = param_iter([cf_steps, 0.4, 1])
# Generate some power spectra, using param_iter
freqs, powers = gen_group_power_spectra(len(cf_steps), freq_range, ap_params, pe_params)
# Plot the generated spectra
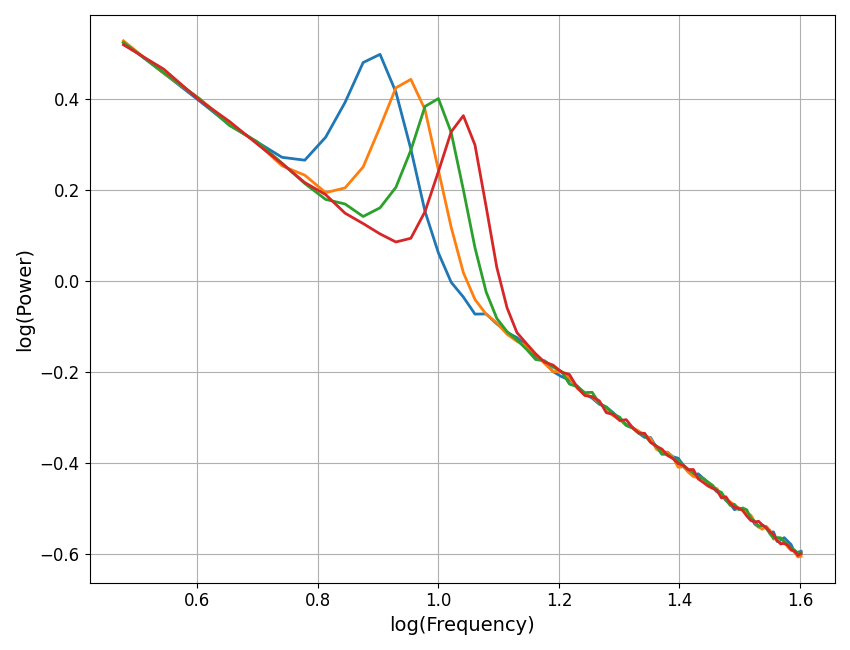
plot_spectra(freqs, powers, log_freqs=True, log_powers=True)

param_jitter
The param_jitter() function can be used to create iterators that
apply some ‘jitter’ to the defined parameter values.
# Define default aperiodic values, with some jitter
#   The first input is the default values, the second the scale of the jitter
#   You can set zero for any value that should not be jittered
ap_params = param_jitter([1, 1], [0.0, 0.15])

# Define the peak parameters, to be stable, with an alpha and a beta
pe_params = [10, 0.2, 1, 22, 0.1, 3]
# Generate some power spectra, using param_jitter
freqs, powers = gen_group_power_spectra(5, freq_range, ap_params, pe_params)
# Plot the generated spectra
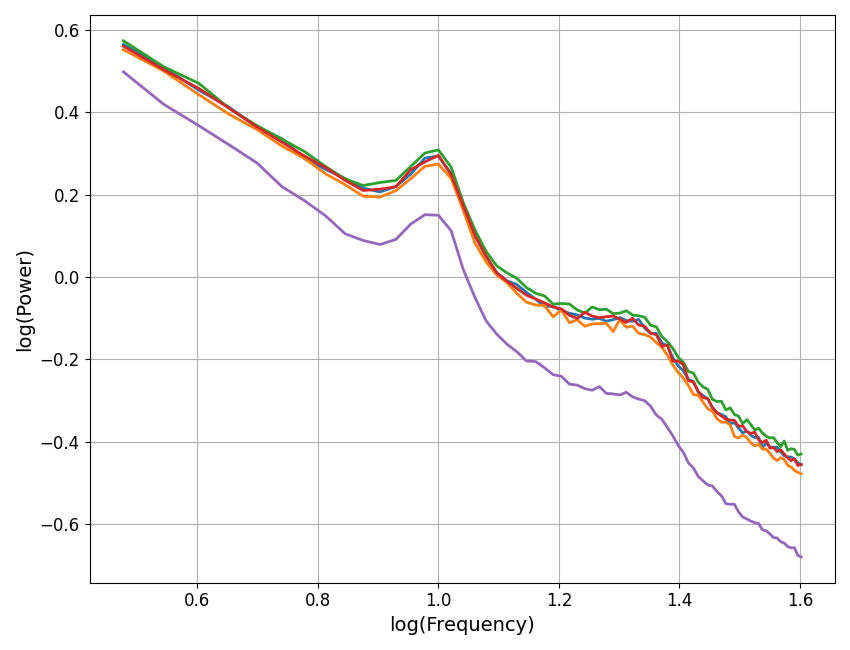
plot_spectra(freqs, powers, log_freqs=True, log_powers=True)

We can see that in the generated spectra above, there is some jitter to the simulated aperiodic exponent values.
Total running time of the script: (0 minutes 0.444 seconds)